

Where it helps
An infographic helps readers understand a process or dataset when a text explanation is hard to scan. The graphic works best when there is an approved story and traceable evidence for the main points.
How the work takes shape
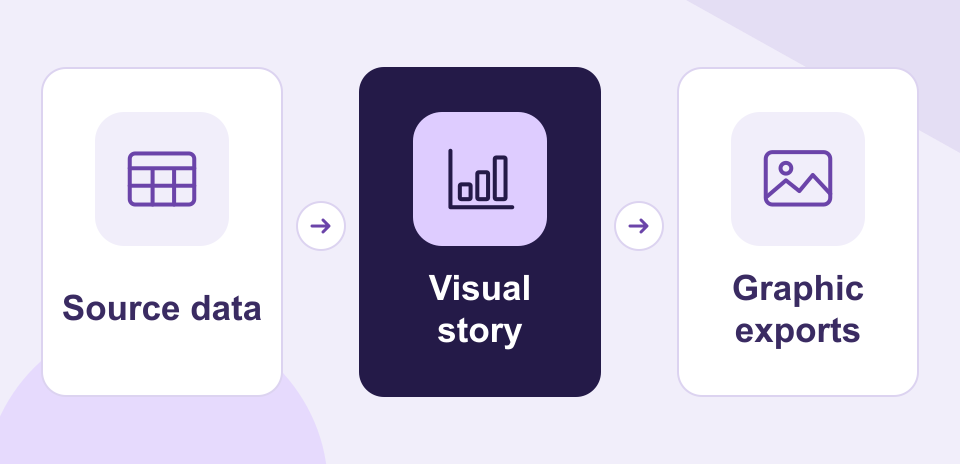
NexSar builds a visual hierarchy around the narrative and selects chart or diagram formats that suit the supplied information. The final exports cover web and document placements.
Example engagement
A research team could turn a published survey into a graphic that introduces the finding, shows three comparisons, and identifies where readers can find the underlying data.